Get the most out of your training
Pricing
| Free | Supporter | Early Premium | |
|---|---|---|---|
|
|
|
||
| € 0 |
€
27
50
per year, when billed yearly
or €2,50 per month, when billed monthly
€
2
50
per month, when billed monthly
or €27,50 per year, when billed yearly
|
€
60
per year, when billed yearly
or €5,50 per month, when billed monthly
€
5
50
per month, when billed monthly
or €60 per year, when billed yearly
|
|
| Create a new account | Create a new account | Create a new account | |
| For athletes that want to enjoy all common features for free. | For athletes that want to support RUNALYZE and love to enjoy all common features ad-free. | For serious athletes who want to get the most out of their training. |
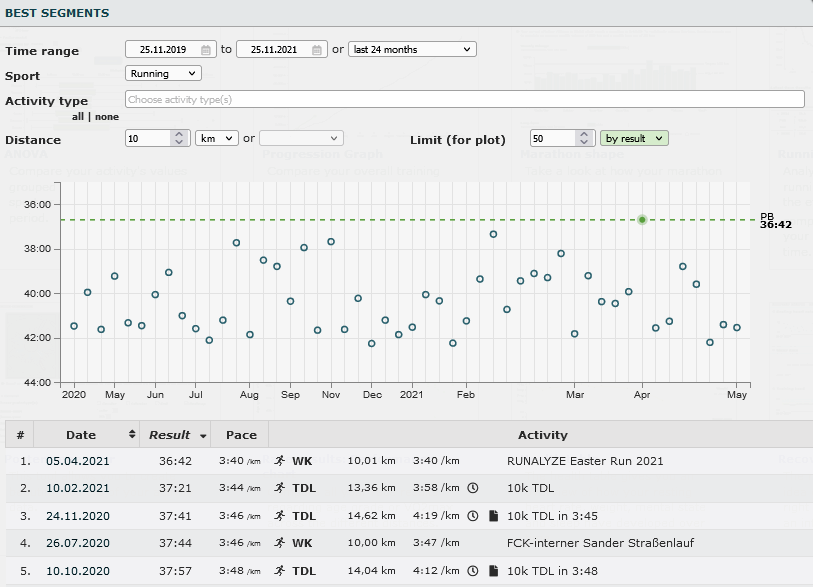
Check your fastest times
You don't run official competitions over all distances, and you don't always achieve your actual best performance in competition. And yet you want to know when you were how fast over a certain distance?
By looking at the best distance results, you can examine your fastest times over a variety of distances - whether from a race or a normal (tempo) workout.
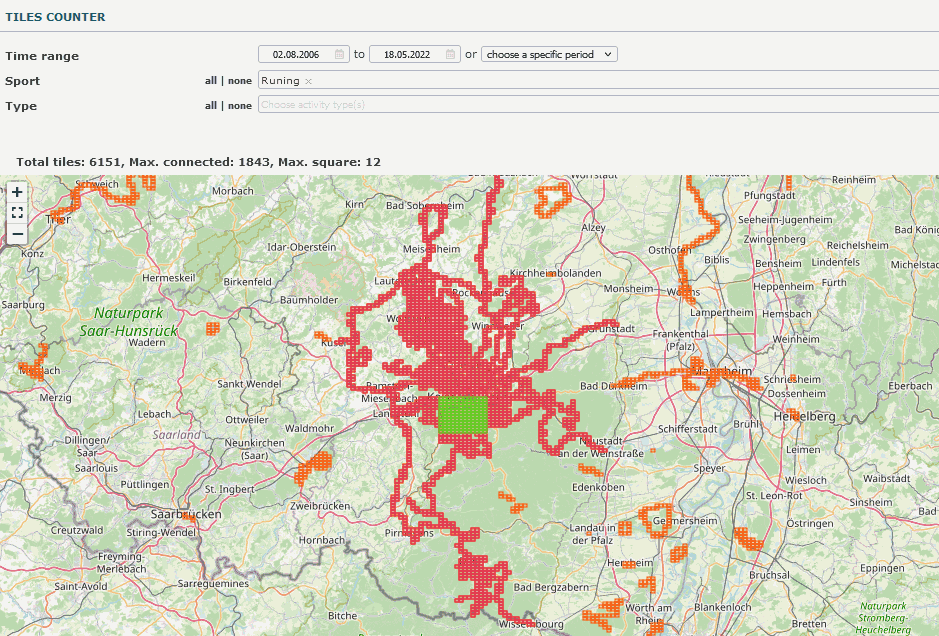
Start chasing tiles
Are you bored with the same routes over and over again? Motivate yourself to explore new routes! Our Tiles counter shows you where you've been and how big your network is. Start exploring new routes and areas now and increase your cluster and max square.
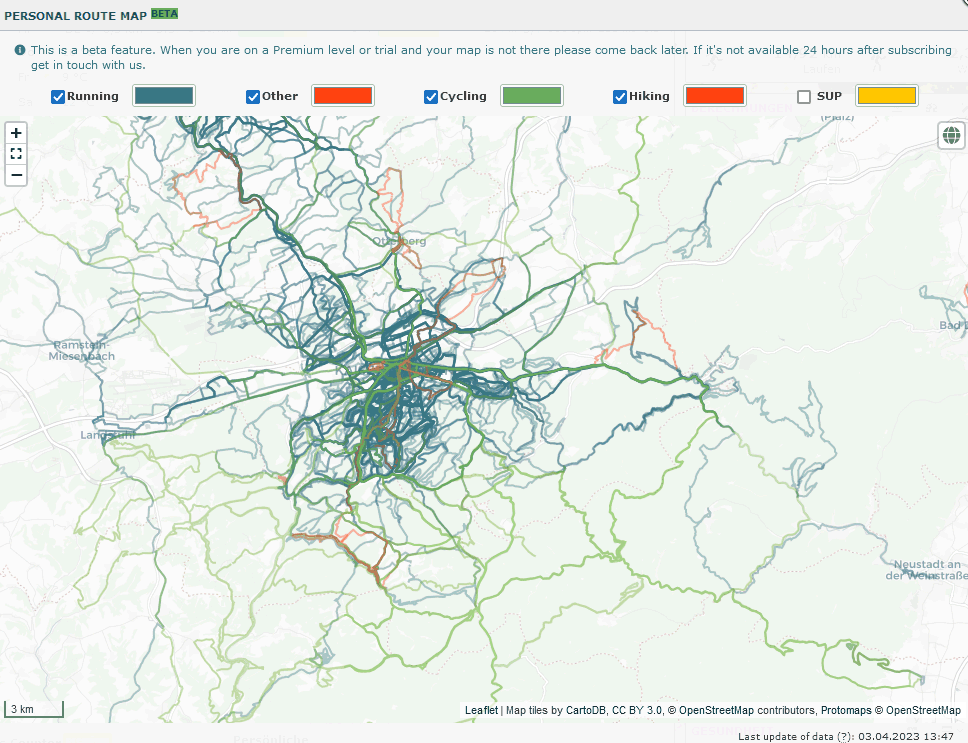
Look at all routes
Your personal route map shows you in detail where you have already been everywhere - separated by sport and individually colorable.
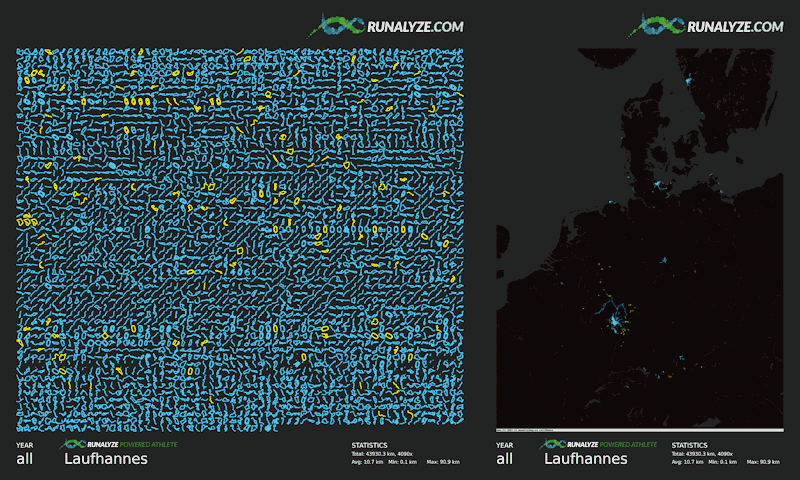
Create poster for all your activities
As a Premium user, you can create the visualization posters for your complete activities across all years, not just for a single year. So you can create the heatmap of your entire sports history. You can also use maps as background for the heatmap.
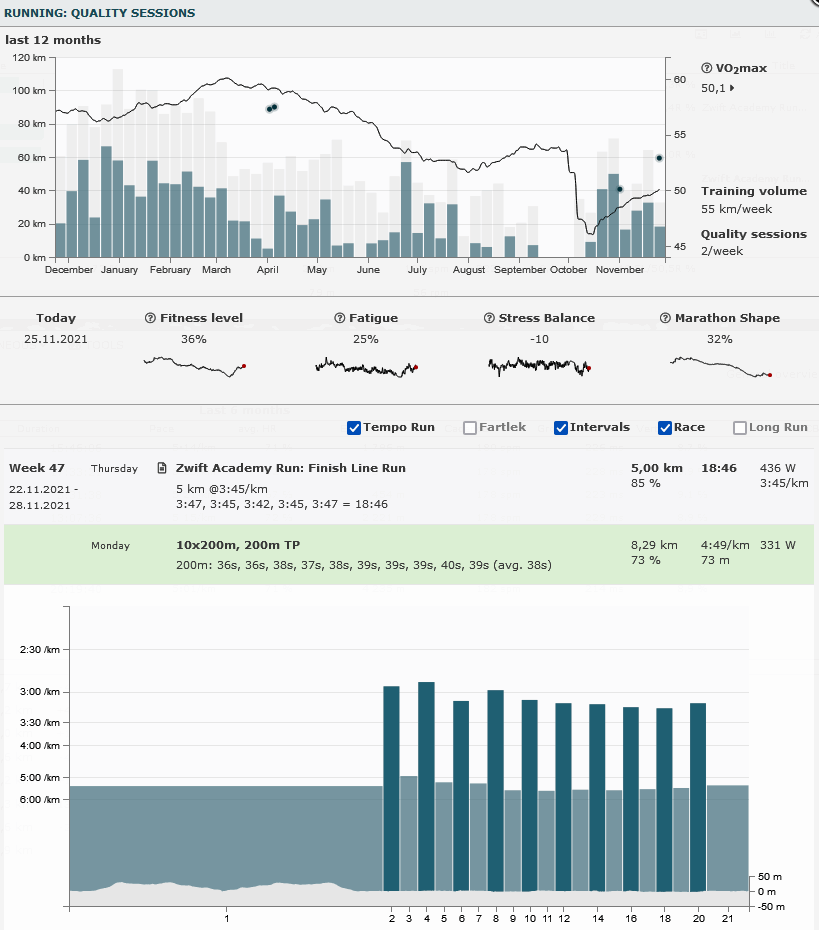
Analyze your quality sessions
In order to be best prepared for the next competition, runners cannot avoid the necessary tempo training.
We offer you a direct look at your key workouts: How did you perform on the paced intervals?
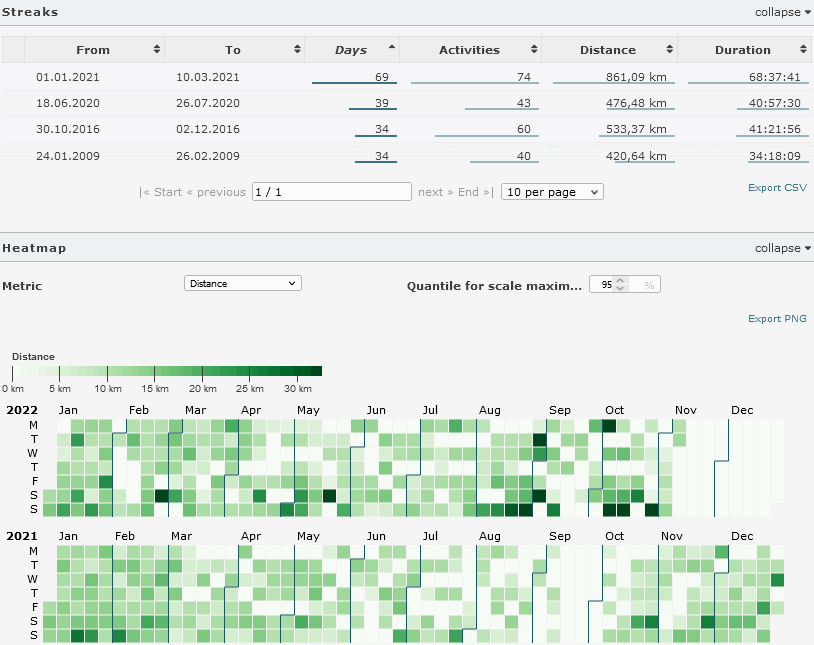
Find and visualize the longest streaks in your training history.
Streak running, i.e. running (or exercising) every day, can be an additional motivation. Runalyze shows you your longest streaks and visualizes your data as a calendar heatmap.
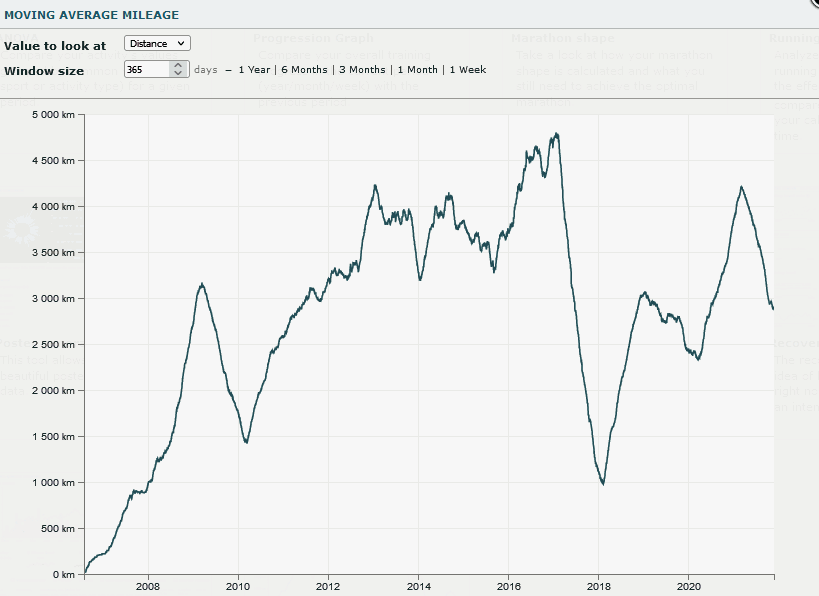
Stop looking only at your weekly mileage
Runners like to look at the exact weekly or monthly mileage. But these values mean little if you suddenly postpone your long run from Sunday to Monday or similar.
That's why we offer you a look at your moving average mileage, whether for a year, a month or a week.
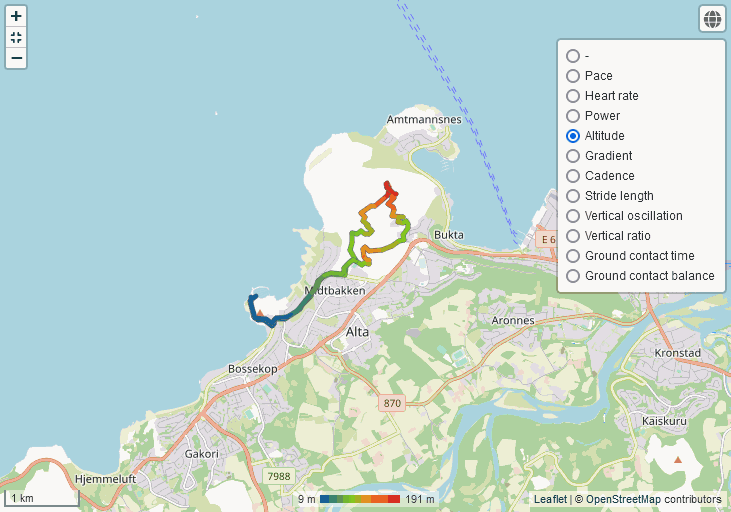
Colored tracks
Track the progress of all your metrics directly visually as a colored track on the map. While this is normally only available for pace, as a Premium user you can also view heart rate, power, elevation, gradient, cadence and stride length.
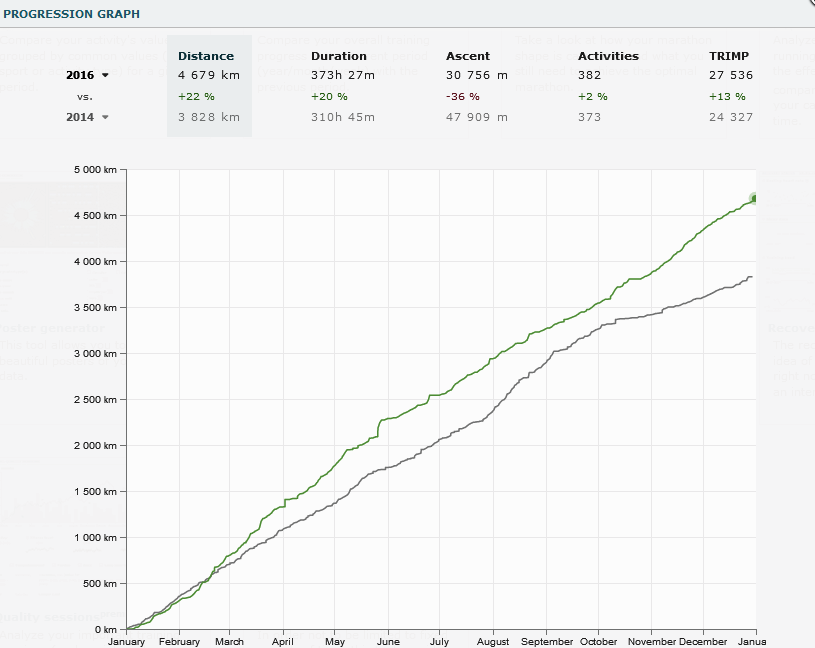
Compare the progression over different years
As a Premium user, you can view not only the current and last year in the progression graphs, but compare any year of your entire sports history.
Pricing
| Free | Supporter | Early Premium | |
|---|---|---|---|
|
|
|
||
| € 0 |
€
27
50
per year, when billed yearly
or €2,50 per month, when billed monthly
€
2
50
per month, when billed monthly
or €27,50 per year, when billed yearly
|
€
60
per year, when billed yearly
or €5,50 per month, when billed monthly
€
5
50
per month, when billed monthly
or €60 per year, when billed yearly
|
|
| Create a new account | Create a new account | Create a new account | |
| For athletes that want to enjoy all common features for free. | For athletes that want to support RUNALYZE and love to enjoy all common features ad-free. | For serious athletes who want to get the most out of their training. | |
|
Automatic Sync
|
|||
|
Performance monitor
|
|||
|
Effective VO2max
|
|||
|
Performance curves
|
|||
| Individual sports, tags, equipment, ... | |||
| Ad-free | |||
|
Beta features
|
|||
| Supporting RUNALYZE | |||
|
Colored tracks
|
|||
|
Progression graph
|
|||
|
Poster generator
|
|||
|
Map layers
|
|||
|
Merchandise discount
|
- | 3% | 5% |
| Create a new account | Create a new account | Create a new account | |






 Follow us